Infographics
Project Brief
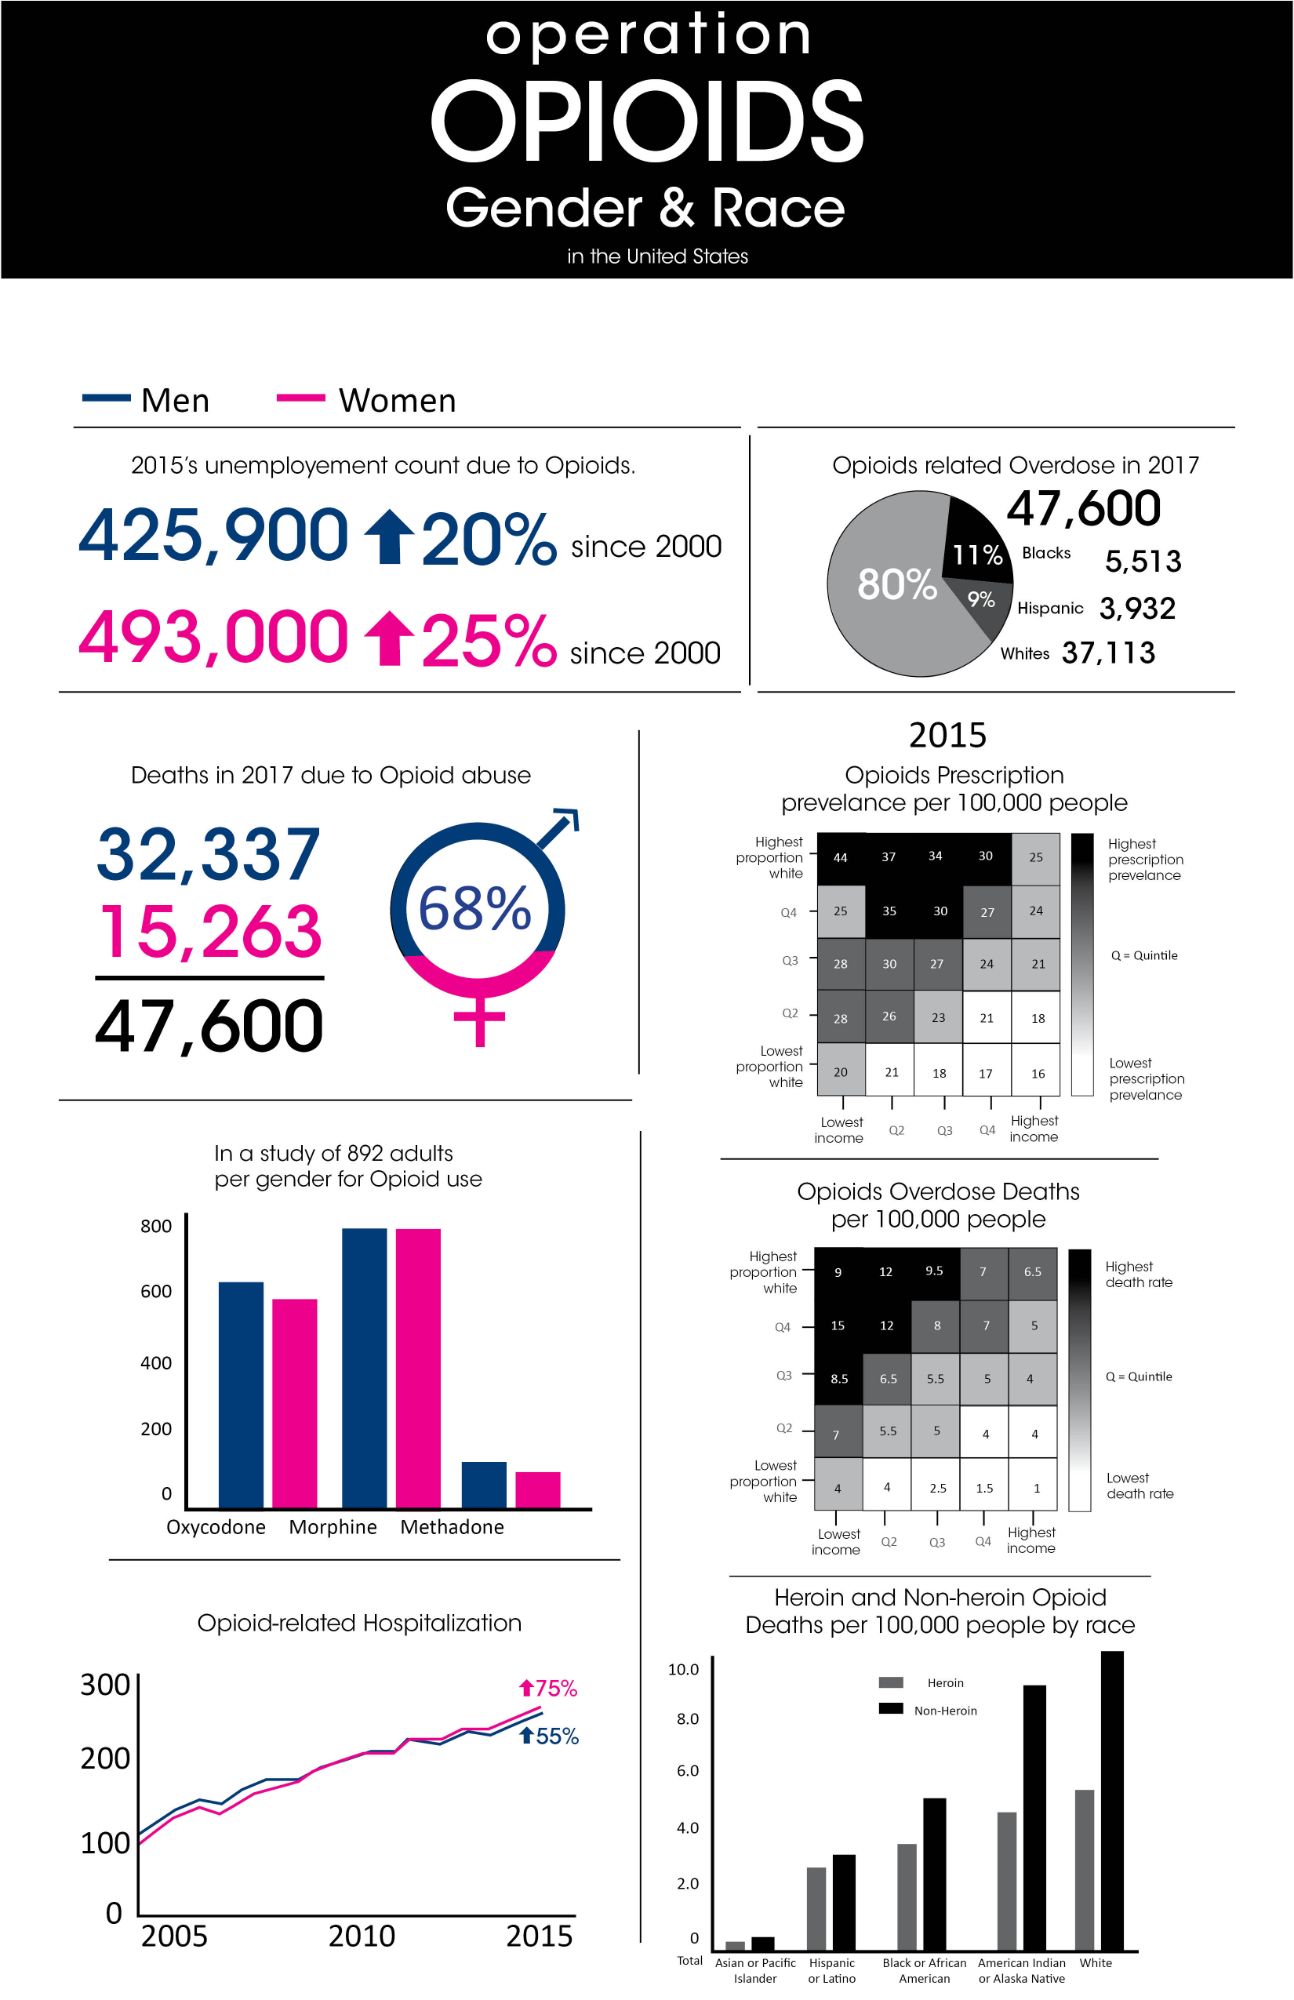
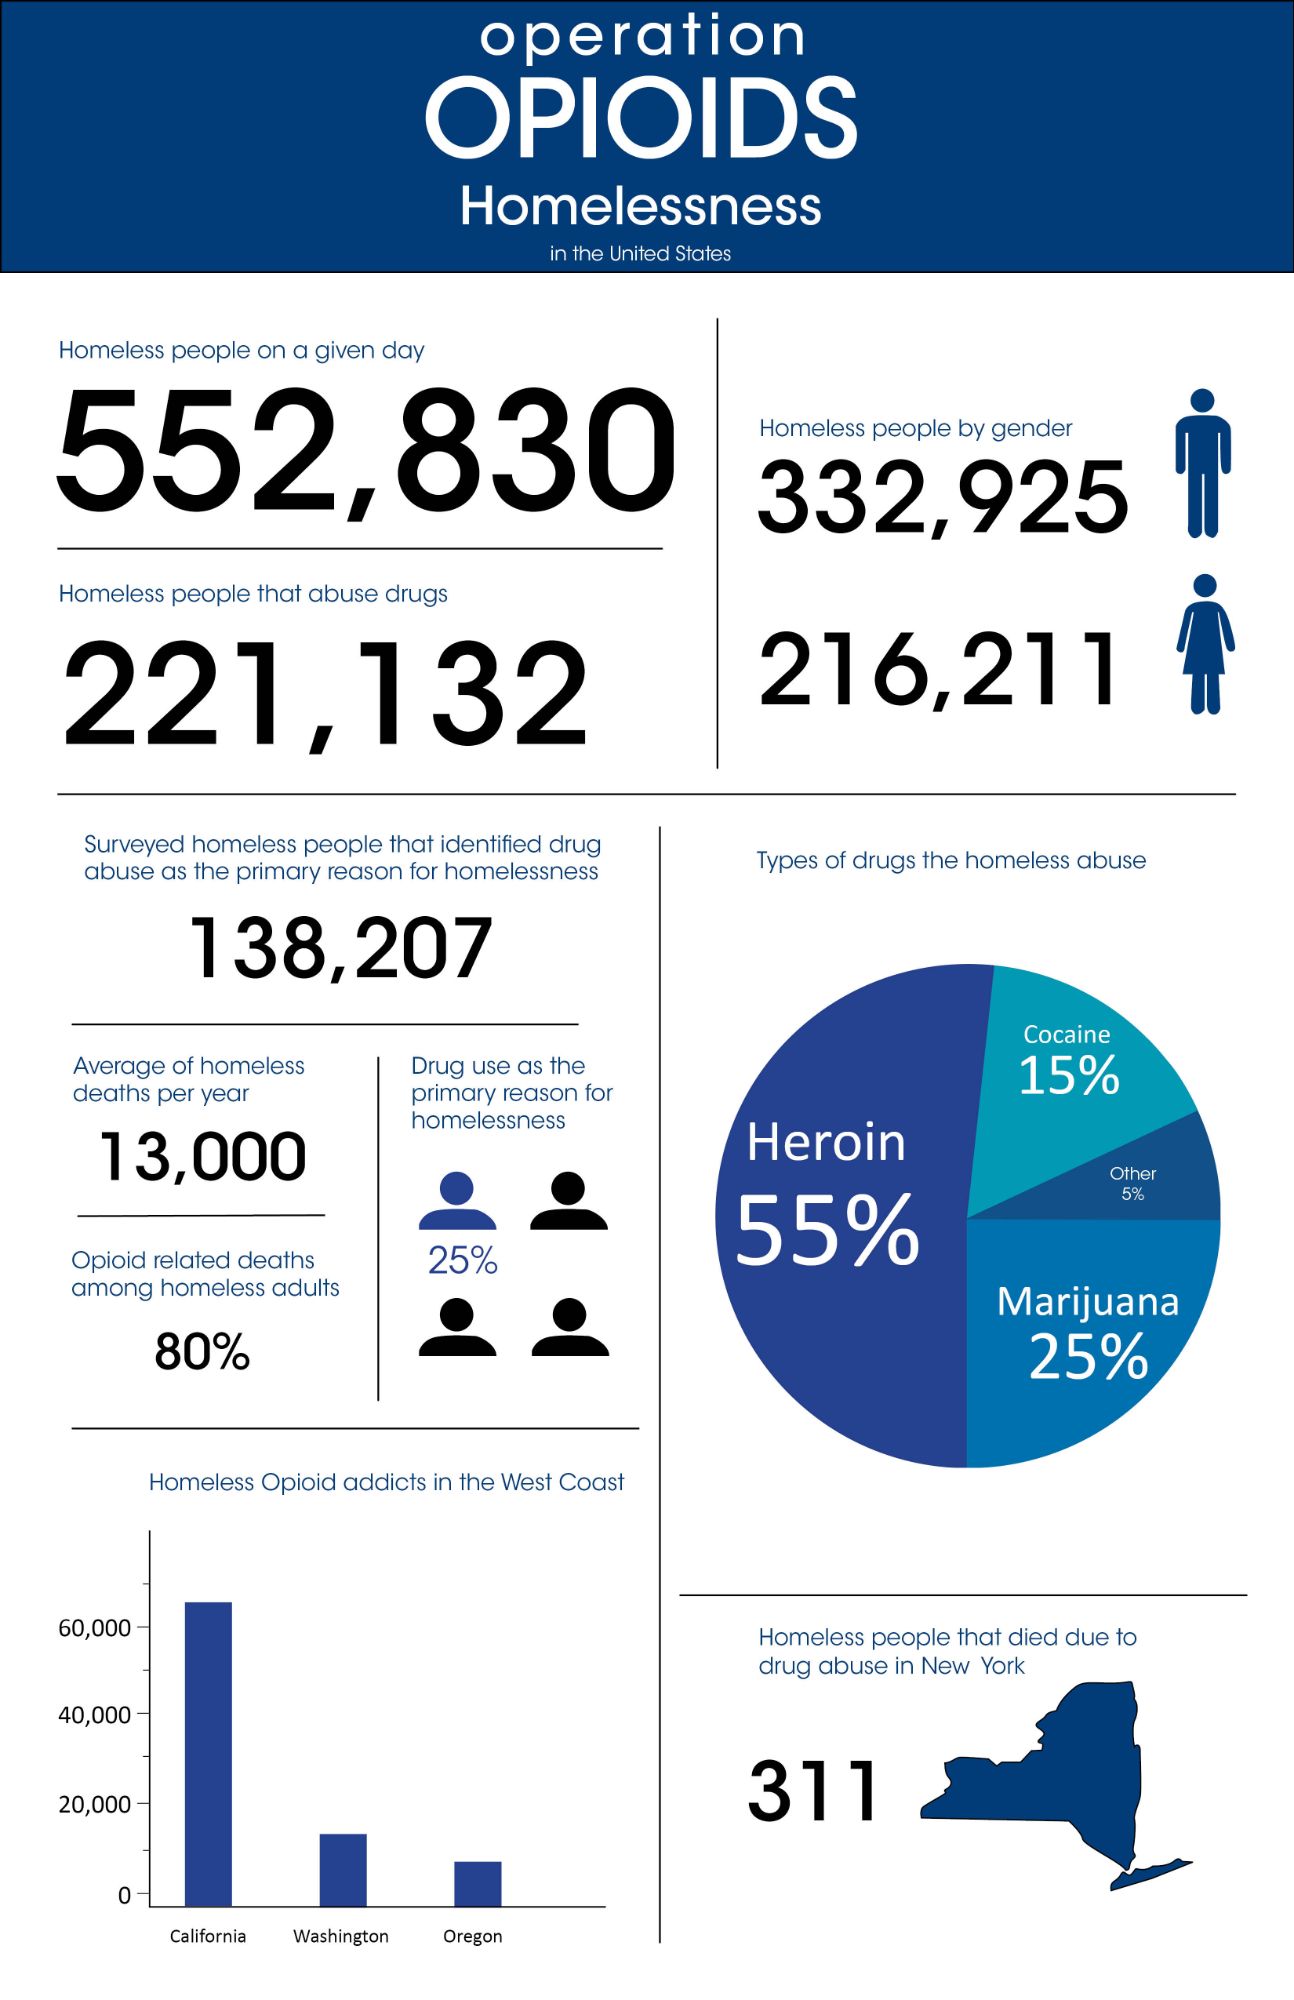
The assignment for this project was to research information on the Opioid Epidemic, break the info down, and create infrographics for it.
Behind the design
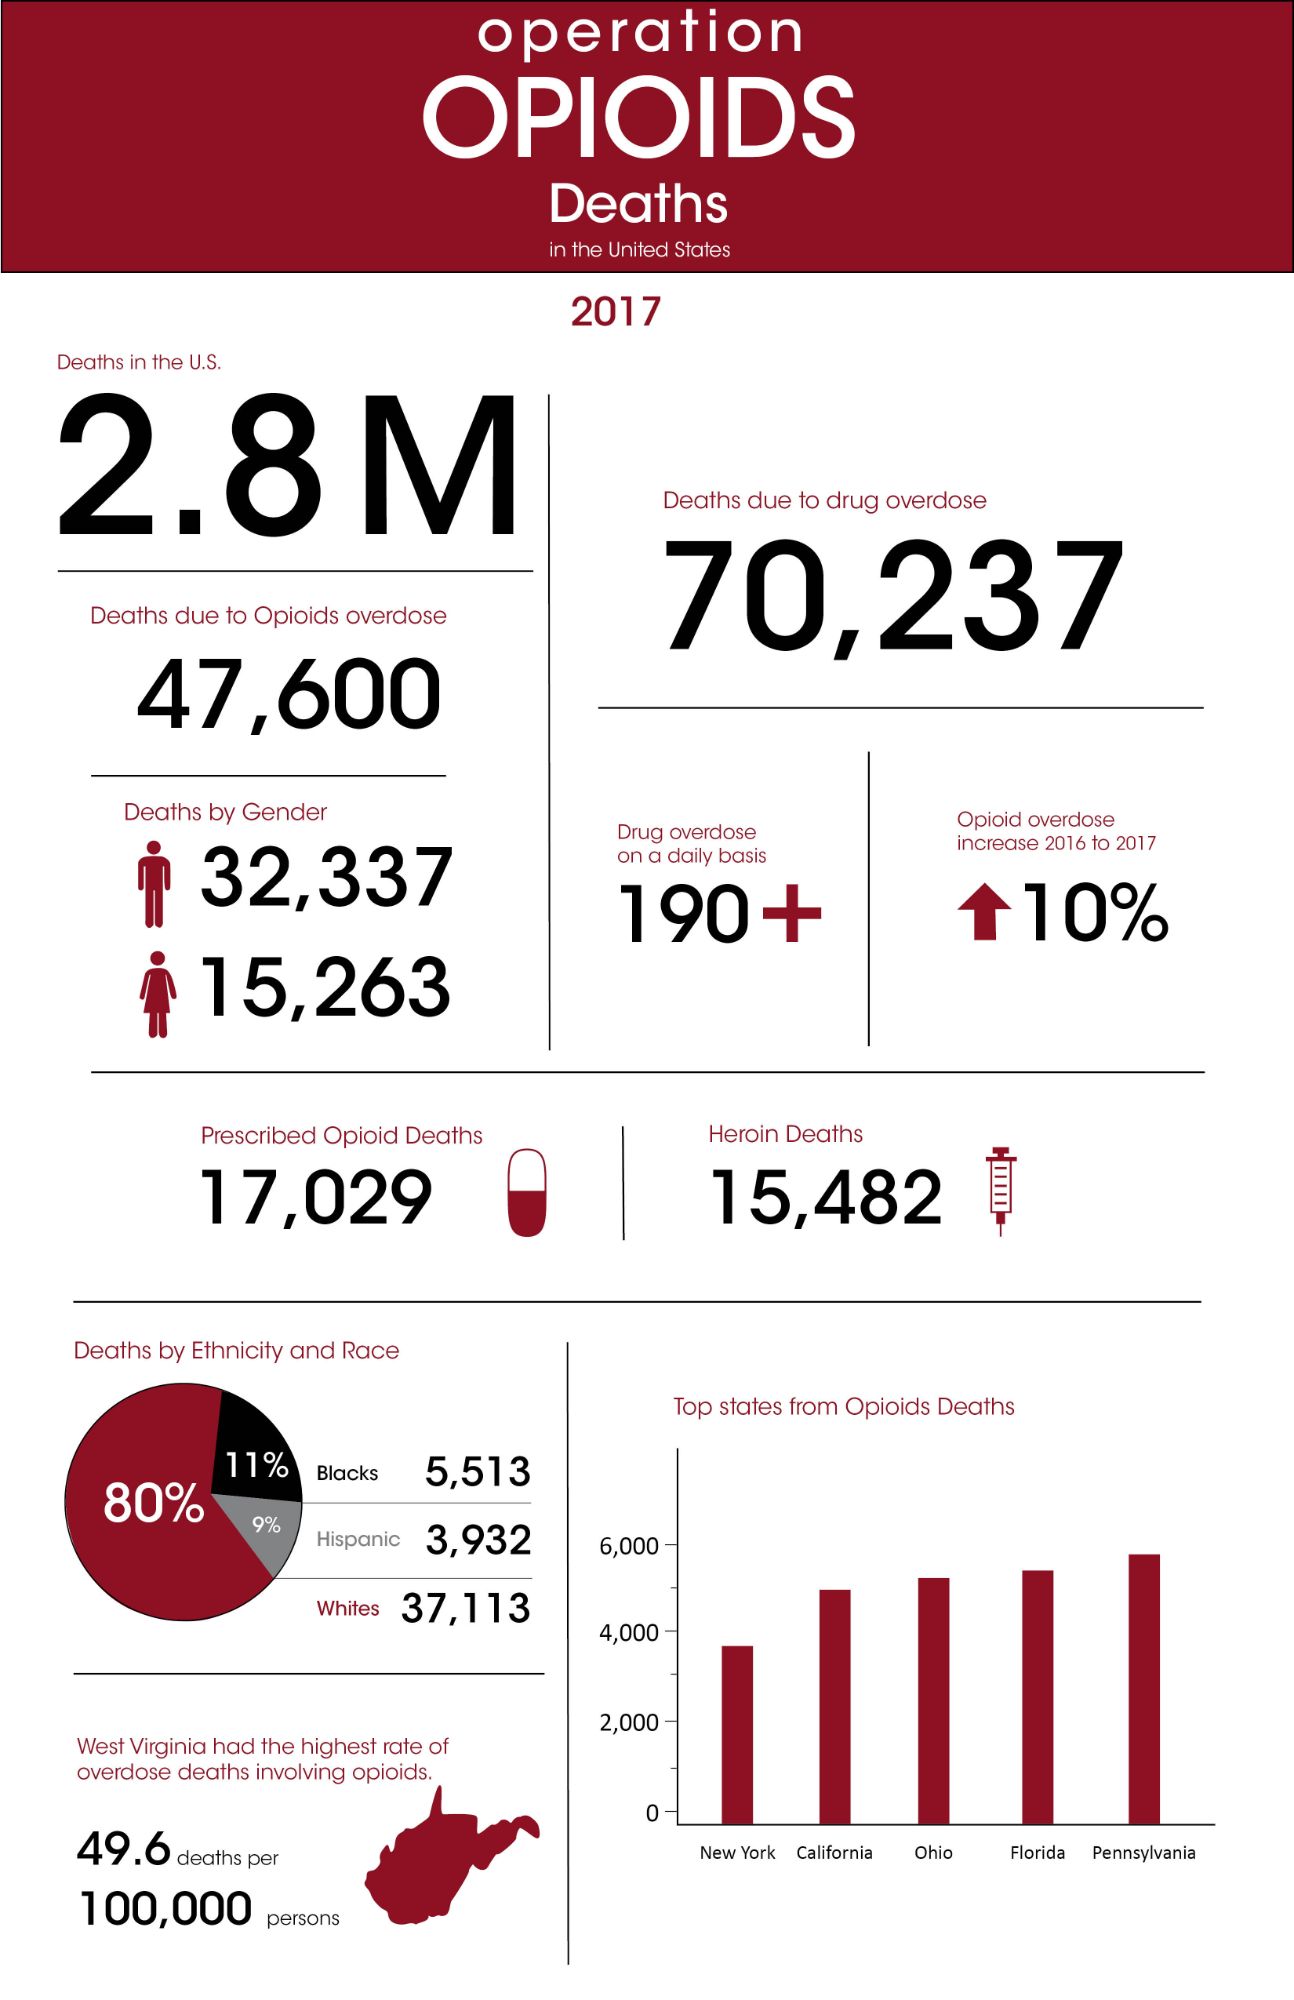
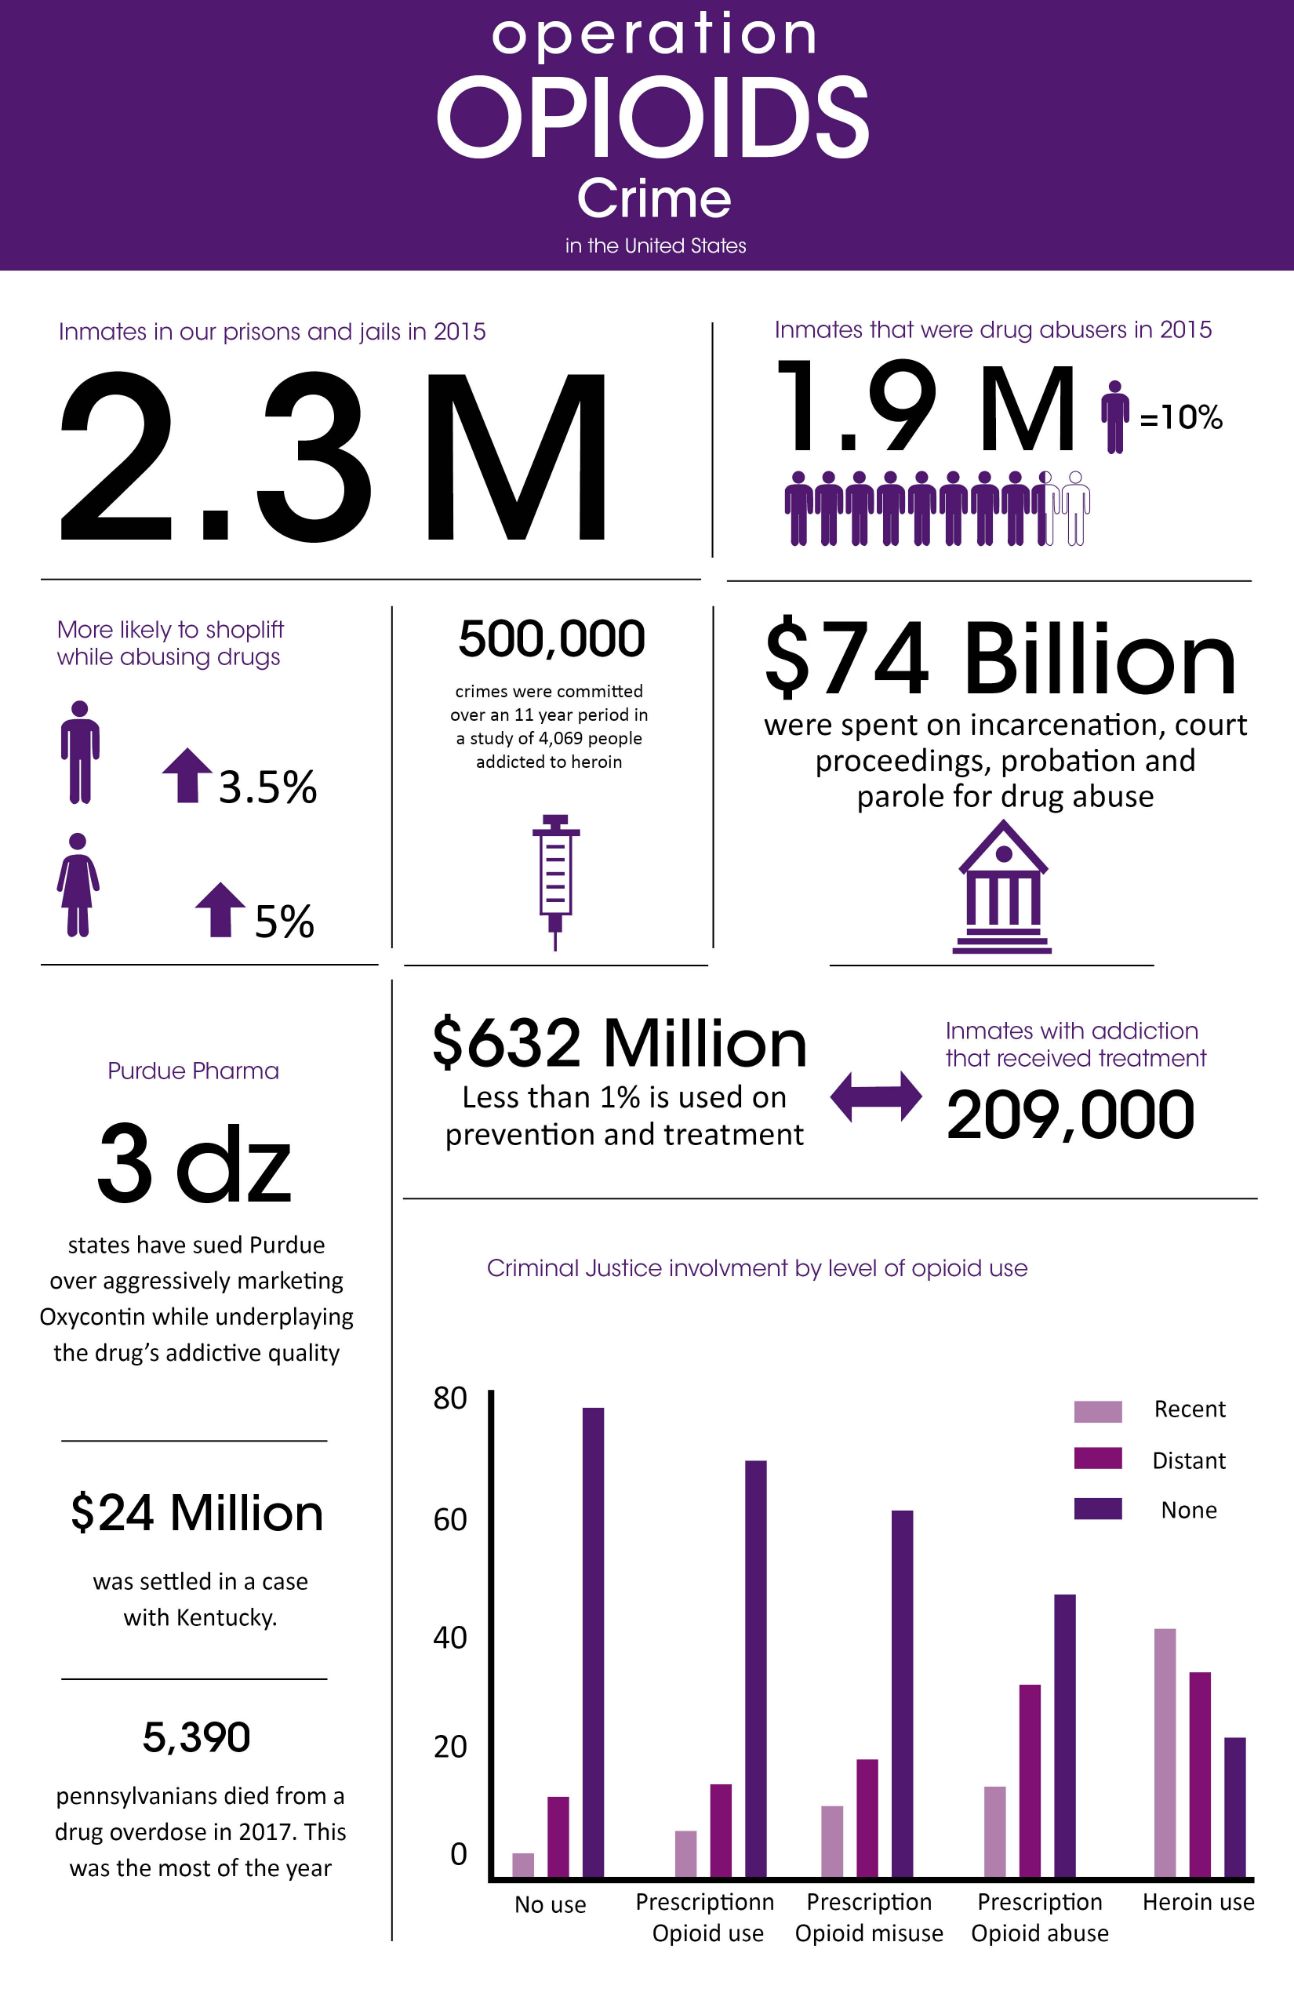
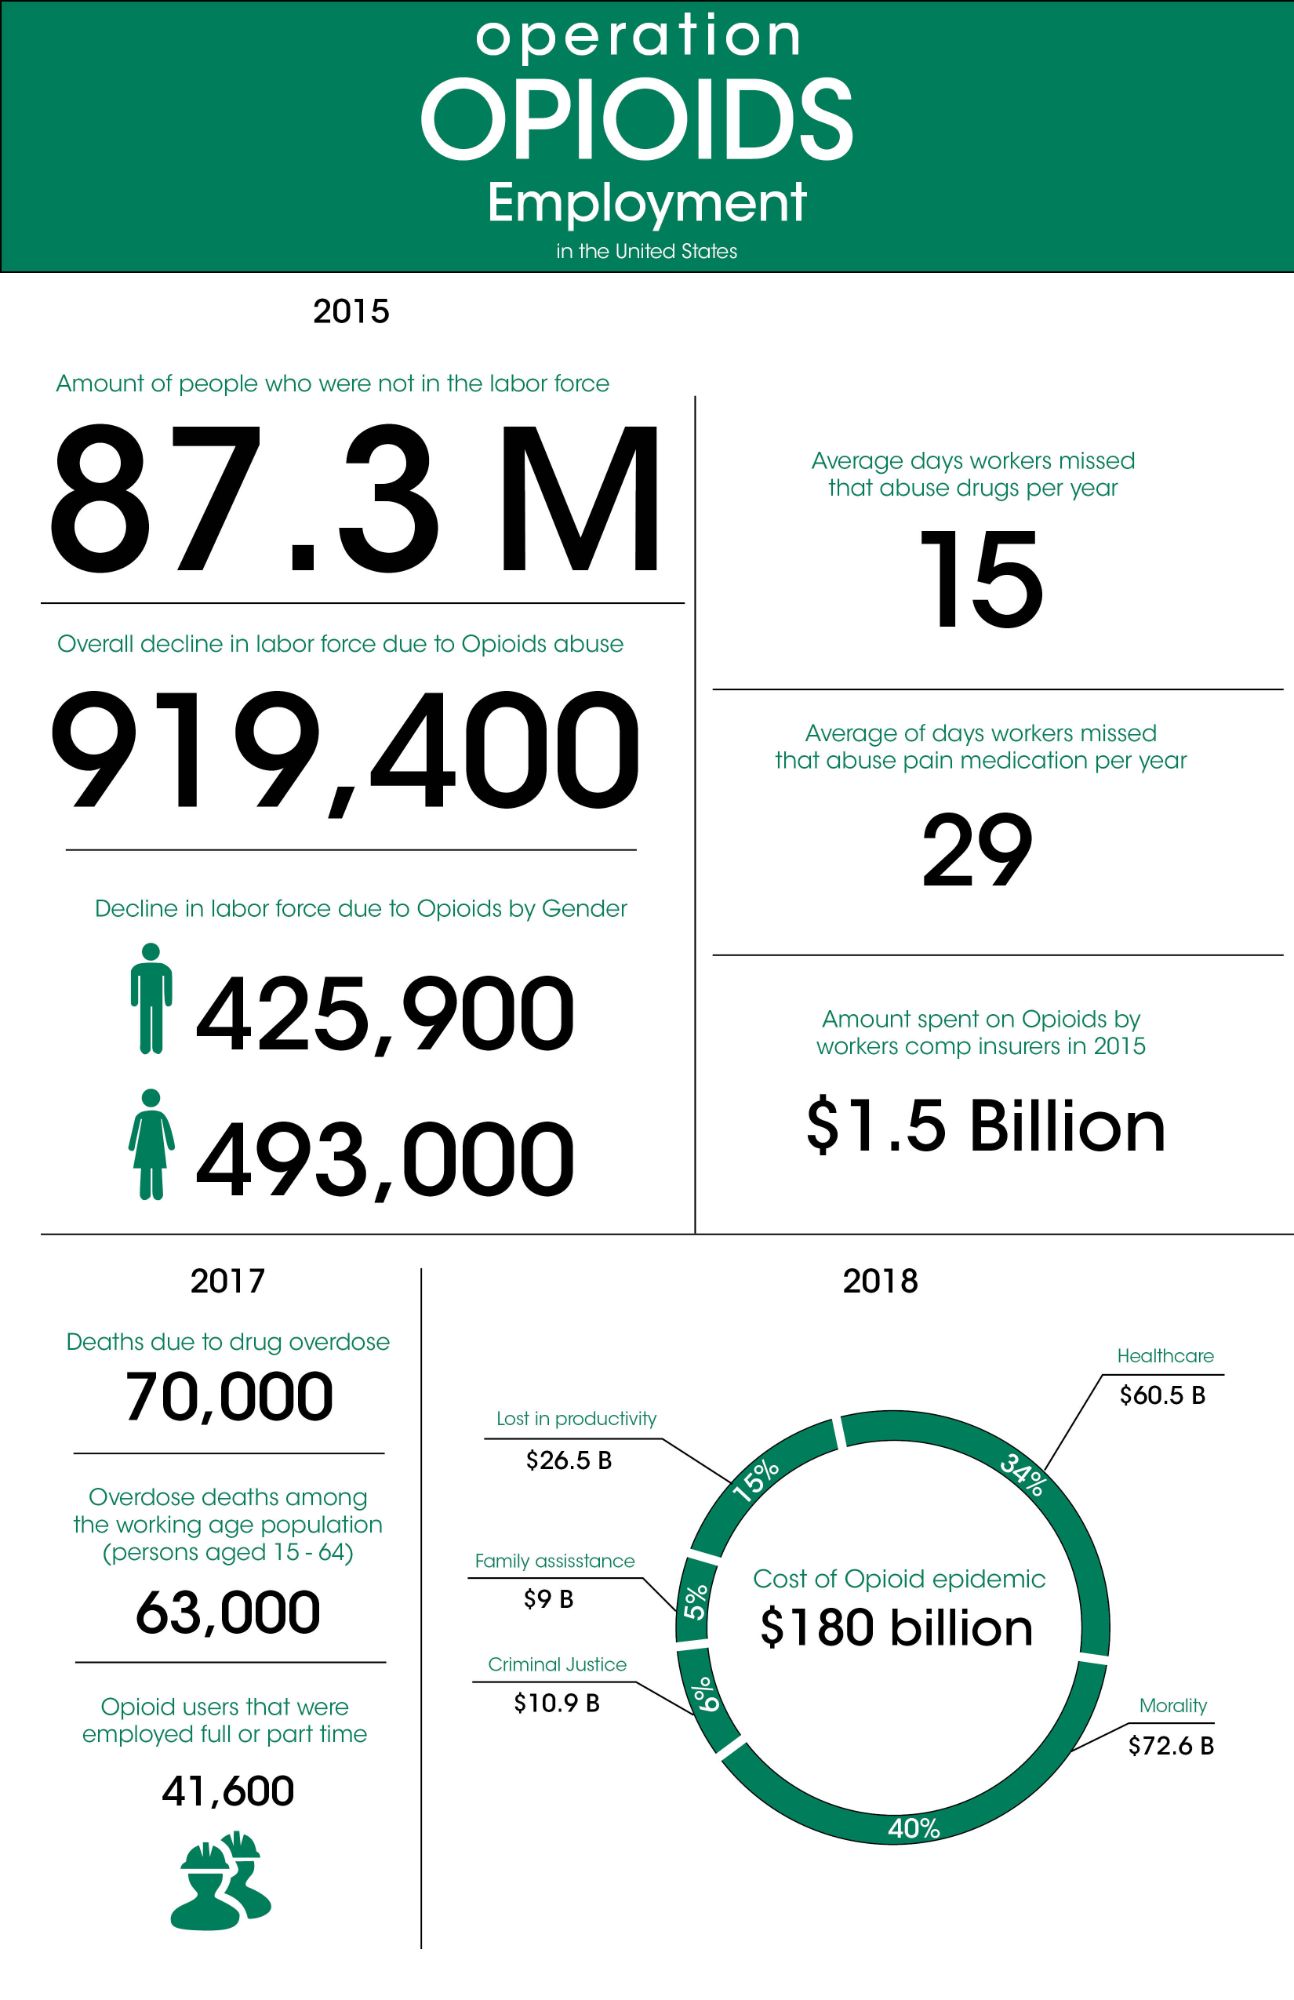
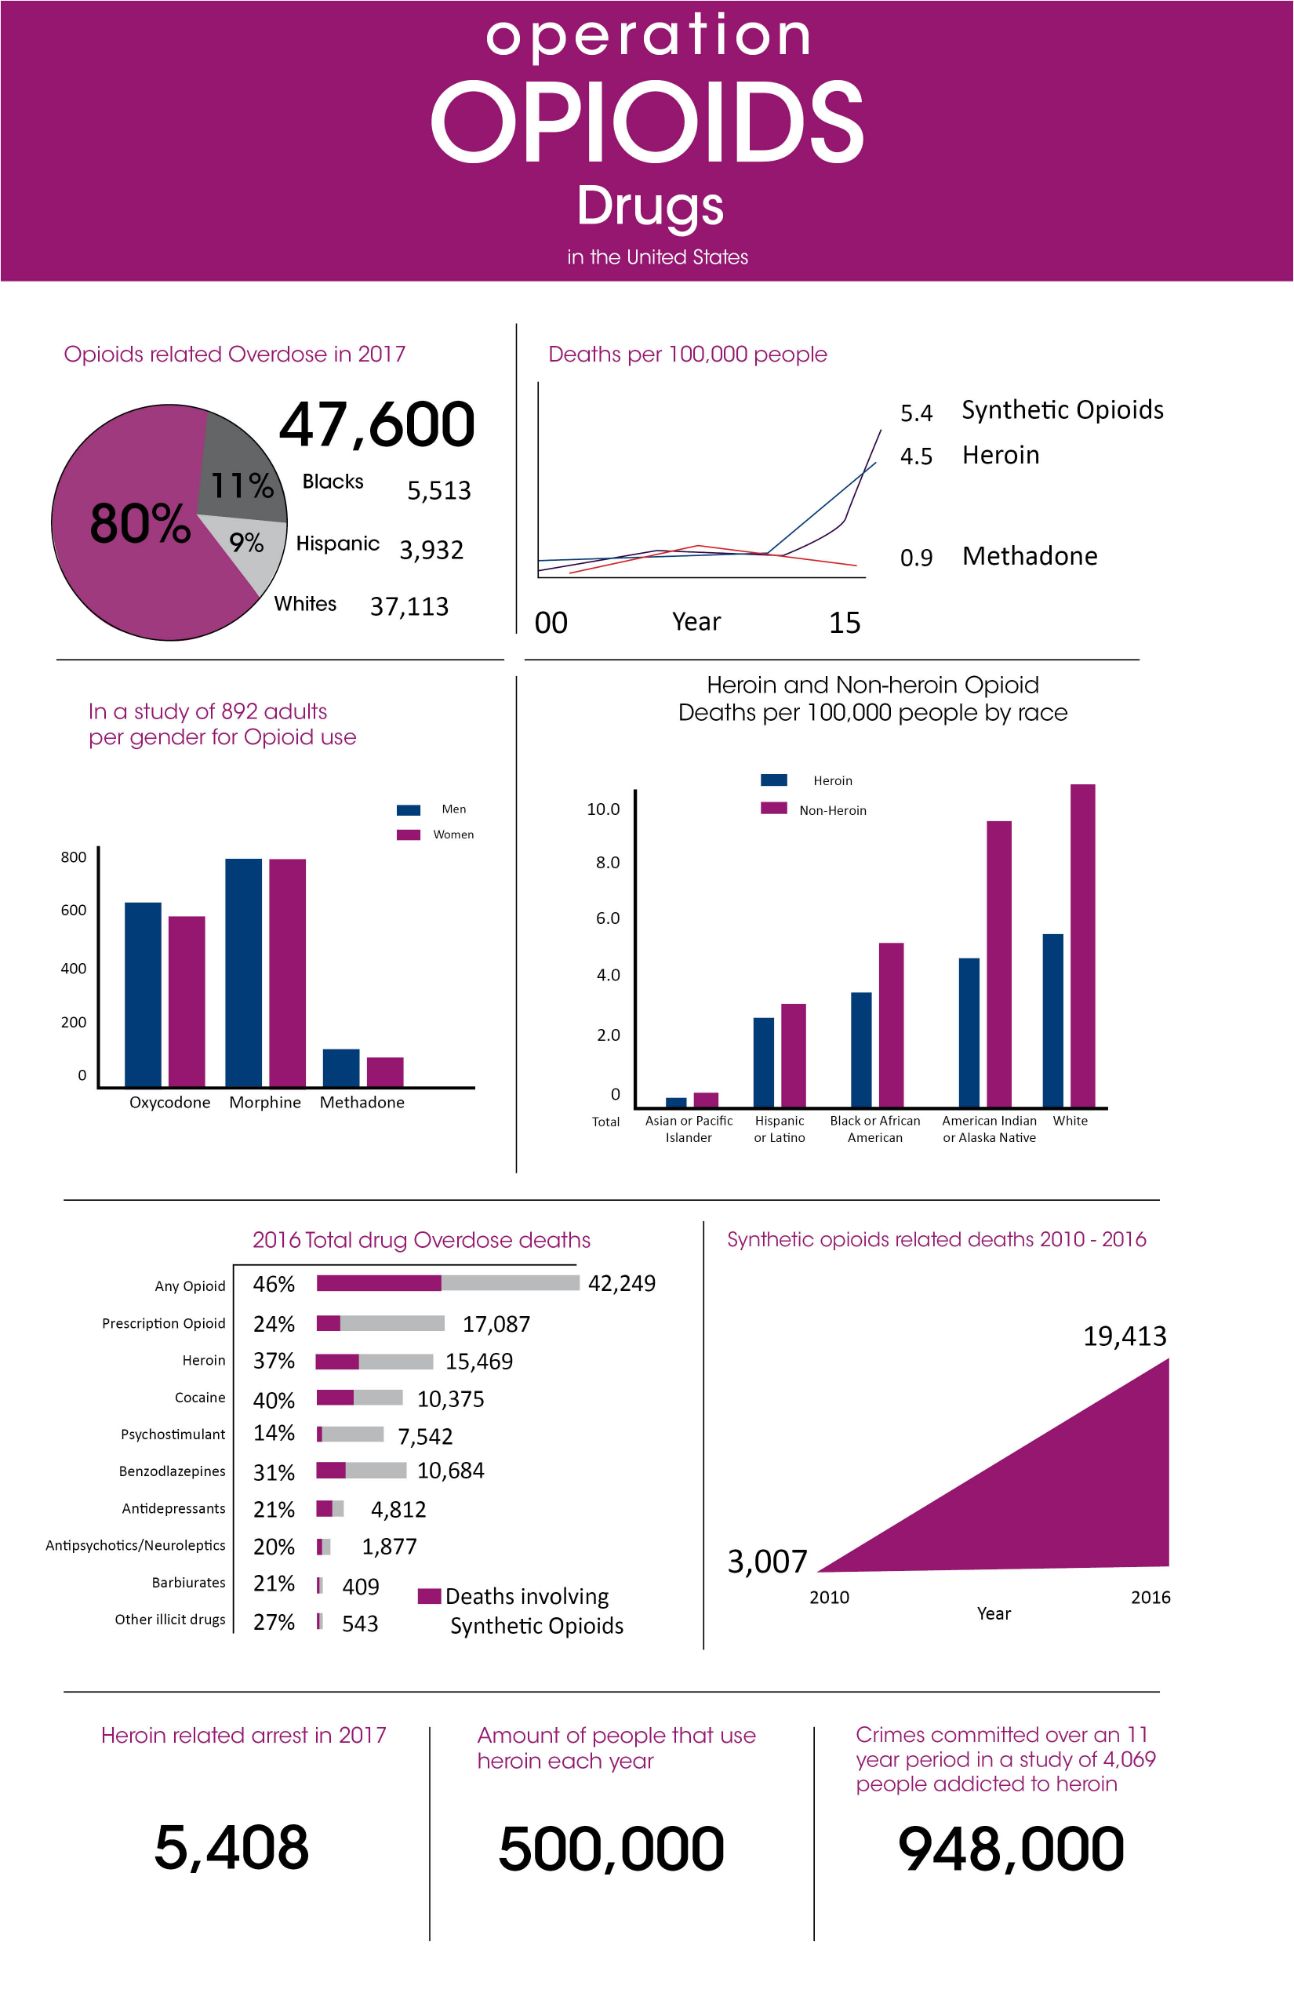
Research was done in several different topics of the Opioid Epidemic. Crime, deaths, employment, homelessness, drug types, gender, and race. I provided ten sections of information per infographic. All sections differ in sizes to keep the composition flowing. Each infographic starts with an overall statistic and is then broken down further. To keep the infographic visually interesting, I added elements such as pie charts, bar graphs, line graphs, and percentages. Each topic has its own dedicated color. They appear on the header, titles of the section, elements, and in any illustration made for the infographic.
Software Used: InDesign, Illustrator
Fonts used: Avant Garde